
Lab 2: Model Selection in scikit-learn#
# General imports
%matplotlib inline
import numpy as np
import pandas as pd
import matplotlib.pyplot as plt
import openml as oml
from matplotlib import cm

# We can ignore ConvergenceWarnings for illustration purposes
import warnings
warnings.simplefilter(action="ignore", category=UserWarning)
Evaluation procedures#
Holdout#
The simplest procedure is train_test_split, which splits arrays or matrices into random train and test subsets.
from sklearn.datasets import make_blobs
from sklearn.linear_model import LogisticRegression
from sklearn.model_selection import train_test_split

# create a synthetic dataset
X, y = make_blobs(centers=2, random_state=0)
# split data and labels into a training and a test set
X_train, X_test, y_train, y_test = train_test_split(X, y, random_state=0)
# Instantiate a model and fit it to the training set
model = LogisticRegression().fit(X_train, y_train)
# evaluate the model on the test set
print("Test set score: {:.2f}".format(model.score(X_test, y_test)))
Test set score: 0.92
Cross-validation#
-
cvparameter defines the kind of cross-validation splits, default is 5-fold CVscoringdefines the scoring metric. Also see below.Returns list of all scores. Models are built internally, but not returned
-
Similar, but also returns the fit and test times, and allows multiple scoring metrics.
from sklearn.model_selection import cross_val_score
from sklearn.datasets import load_iris
from sklearn.linear_model import LogisticRegression

iris = load_iris()
logreg = LogisticRegression()

scores = cross_val_score(logreg, iris.data, iris.target, cv=5)
print("Cross-validation scores: {}".format(scores))
print("Average cross-validation score: {:.2f}".format(scores.mean()))
print("Variance in cross-validation score: {:.4f}".format(np.var(scores)))
Cross-validation scores: [0.96666667 1.         0.93333333 0.96666667 1.        ]
Average cross-validation score: 0.97
Variance in cross-validation score: 0.0006
Custom CV splits#
You can build folds manually with KFold or StratifiedKFold
randomizable (
shuffleparameter)
LeaveOneOut does leave-one-out cross-validation
from sklearn.model_selection import KFold, StratifiedKFold
kfold = KFold(n_splits=5)
print("Cross-validation scores KFold(n_splits=5):\n{}".format(
      cross_val_score(logreg, iris.data, iris.target, cv=kfold)))
skfold = StratifiedKFold(n_splits=5, shuffle=True)
print("Cross-validation scores StratifiedKFold(n_splits=5, shuffle=True):\n{}".format(
      cross_val_score(logreg, iris.data, iris.target, cv=skfold)))
Cross-validation scores KFold(n_splits=5):
[1.         1.         0.86666667 0.93333333 0.83333333]
Cross-validation scores StratifiedKFold(n_splits=5, shuffle=True):
[0.93333333 0.93333333 1.         0.96666667 0.96666667]
from sklearn.model_selection import LeaveOneOut
loo = LeaveOneOut()
scores = cross_val_score(logreg, iris.data, iris.target, cv=loo)
print("Number of cv iterations: ", len(scores))
print("Mean accuracy: {:.2f}".format(scores.mean()))
Number of cv iterations:  150
Mean accuracy: 0.97
Shuffle-split#
These shuffle the data before splitting it.
ShuffleSplitandStratifiedShuffleSplit(recommended for classification)train_sizeandtest_sizecan be absolute numbers or a percentage of the total dataset
from sklearn.model_selection import ShuffleSplit, StratifiedShuffleSplit
shuffle_split = StratifiedShuffleSplit(test_size=.5, train_size=.5, n_splits=10)
scores = cross_val_score(logreg, iris.data, iris.target, cv=shuffle_split)
print("Cross-validation scores:\n{}".format(scores))
Cross-validation scores:
[0.93333333 0.98666667 0.97333333 0.94666667 0.90666667 0.94666667
 0.98666667 0.96       0.96       0.96      ]
Grouped cross-validation#
Add an array with group membership to
cross_val_scoresUse
GroupKFoldwith the number of groups as CV procedure
from sklearn.model_selection import GroupKFold
# create synthetic dataset
X, y = make_blobs(n_samples=12, random_state=0)
# the first three samples belong to the same group, etc.
groups = [0, 0, 0, 1, 1, 1, 2, 2, 2, 3, 3, 3]
scores = cross_val_score(logreg, X, y, groups=groups, cv=GroupKFold(n_splits=4))
print("Cross-validation scores :\n{}".format(scores))
Cross-validation scores :
[0.66666667 0.66666667 1.         0.66666667]
Evaluation Metrics#
Binary classification#
confusion_matrix returns a matrix counting how many test examples are predicted correctly or ‘confused’ with other metrics.
sklearn.metrics contains implementations many of the metrics discussed in class
They are all implemented so that ‘higher is better’.
accuracy_score computes accuracy explictly
classification_report returns a table of binary measures, per class, and aggregated according to different aggregation functions.
from sklearn.metrics import accuracy_score, confusion_matrix, classification_report, f1_score
from sklearn.model_selection import train_test_split
from sklearn.datasets import load_breast_cancer
from sklearn.linear_model import LogisticRegression
data = load_breast_cancer()
X_train, X_test, y_train, y_test = train_test_split(
    data.data, data.target, stratify=data.target, random_state=0)
lr = LogisticRegression().fit(X_train, y_train)
y_pred = lr.predict(X_test)

print("confusion_matrix(y_test, y_pred): \n", confusion_matrix(y_test, y_pred))
print("accuracy_score(y_test, y_pred): ", accuracy_score(y_test, y_pred))
print("model.score(X_test, y_test): ", lr.score(X_test, y_test))
confusion_matrix(y_test, y_pred):
 [[48  5]
 [ 5 85]]
accuracy_score(y_test, y_pred):  0.9300699300699301
model.score(X_test, y_test):  0.9300699300699301
plt.rcParams['figure.dpi'] = 100
print(classification_report(y_test, lr.predict(X_test)))
              precision    recall  f1-score   support

           0       0.91      0.91      0.91        53
           1       0.94      0.94      0.94        90

    accuracy                           0.93       143
   macro avg       0.93      0.93      0.93       143
weighted avg       0.93      0.93      0.93       143
You can explictly define the averaging function for class-level metrics
pred = lr.predict(X_test)
print("Micro average f1 score: {:.3f}".format(f1_score(y_test, pred, average="micro")))
print("Weighted average f1 score: {:.3f}".format(f1_score(y_test, pred, average="weighted")))
print("Macro average f1 score: {:.3f}".format(f1_score(y_test, pred, average="macro")))
Micro average f1 score: 0.930
Weighted average f1 score: 0.930
Macro average f1 score: 0.925
Probabilistic predictions#
To retrieve the uncertainty in the prediction, scikit-learn offers 2 functions. Often, both are available for every learner, but not always.
decision_function: returns floating point (-Inf,Inf) value for each prediction
predict_proba: returns probability [0,1] for each prediction
You can also use these to compute any metric with non-standard thresholds
print("Threshold -0.8")
y_pred_lower_threshold = lr.decision_function(X_test) > -.8
print(classification_report(y_test, y_pred_lower_threshold))
Threshold -0.8
              precision    recall  f1-score   support

           0       0.94      0.89      0.91        53
           1       0.94      0.97      0.95        90

    accuracy                           0.94       143
   macro avg       0.94      0.93      0.93       143
weighted avg       0.94      0.94      0.94       143
Uncertainty in multi-class classification#
decision_functionandpredict_probaalso work in the multiclass settingalways have shape (n_samples, n_classes)
Example on the Iris dataset, which has 3 classes:
from sklearn.datasets import load_iris

iris = load_iris()
X_train2, X_test2, y_train2, y_test2 = train_test_split(
    iris.data, iris.target, random_state=42)

lr2 = LogisticRegression()
lr2 = lr2.fit(X_train2, y_train2)

print("Decision function:\n{}".format(lr2.decision_function(X_test2)[:6, :]))
# show the first few entries of predict_proba
print("Predicted probabilities:\n{}".format(lr2.predict_proba(X_test2)[:6]))
Decision function:
[[ -3.03499211   2.29425161   0.7407405 ]
 [  5.91897372   3.09086147  -9.0098352 ]
 [-10.05185099   1.87457159   8.17727941]
 [ -2.73279105   2.03622549   0.69656555]
 [ -3.73730572   2.47556657   1.26173915]
 [  6.03557844   3.0345983   -9.07017674]]
Predicted probabilities:
[[3.98547105e-03 8.22130578e-01 1.73883951e-01]
 [9.44175894e-01 5.58237959e-02 3.10136994e-07]
 [1.20891186e-08 1.82799143e-03 9.98171996e-01]
 [6.68180705e-03 7.87139122e-01 2.06179071e-01]
 [1.54224758e-03 7.69786431e-01 2.28671321e-01]
 [9.52618137e-01 4.73816007e-02 2.62163802e-07]]
Precision-Recall and ROC curves#
precision_recall_curve returns all precision and recall values for all possible thresholds
roc_curve does the same for TPR and FPR.
The average precision score is returned by the
average_precision_scoremeasureThe area under the ROC curve is returned by the
roc_auc_scoremeasureDon’t use
auc(this uses a less accurate trapezoidal rule)Require a decision function or predict_proba.
from sklearn.metrics import precision_recall_curve
precision, recall, thresholds = precision_recall_curve(
    y_test, lr.decision_function(X_test))
from sklearn.metrics import average_precision_score
ap_pp = average_precision_score(y_test, lr.predict_proba(X_test)[:, 1])
ap_df = average_precision_score(y_test, lr.decision_function(X_test))
print("Average precision of logreg: {:.3f}".format(ap_df))
Average precision of logreg: 0.995
from sklearn.metrics import roc_auc_score
rf_auc = roc_auc_score(y_test, lr.predict_proba(X_test)[:, 1])
svc_auc = roc_auc_score(y_test, lr.decision_function(X_test))
print("AUC for Random Forest: {:.3f}".format(rf_auc))
print("AUC for SVC: {:.3f}".format(svc_auc))
AUC for Random Forest: 0.991
AUC for SVC: 0.991
Multi-class prediction#
Build C models, one for every class vs all others
Use micro-, macro-, or weighted averaging
print("Micro average f1 score: {:.3f}".format(f1_score(y_test, pred, average="micro")))
print("Weighted average f1 score: {:.3f}".format(f1_score(y_test, pred, average="weighted")))
print("Macro average f1 score: {:.3f}".format(f1_score(y_test, pred, average="macro")))
Micro average f1 score: 0.930
Weighted average f1 score: 0.930
Macro average f1 score: 0.925
Using evaluation metrics in model selection#
You typically want to use AUC or other relevant measures in
cross_val_scoreandGridSearchCVinstead of the default accuracy.scikit-learn makes this easy through the
scoringargumentBut, you need to need to look the mapping between the scorer and the metric
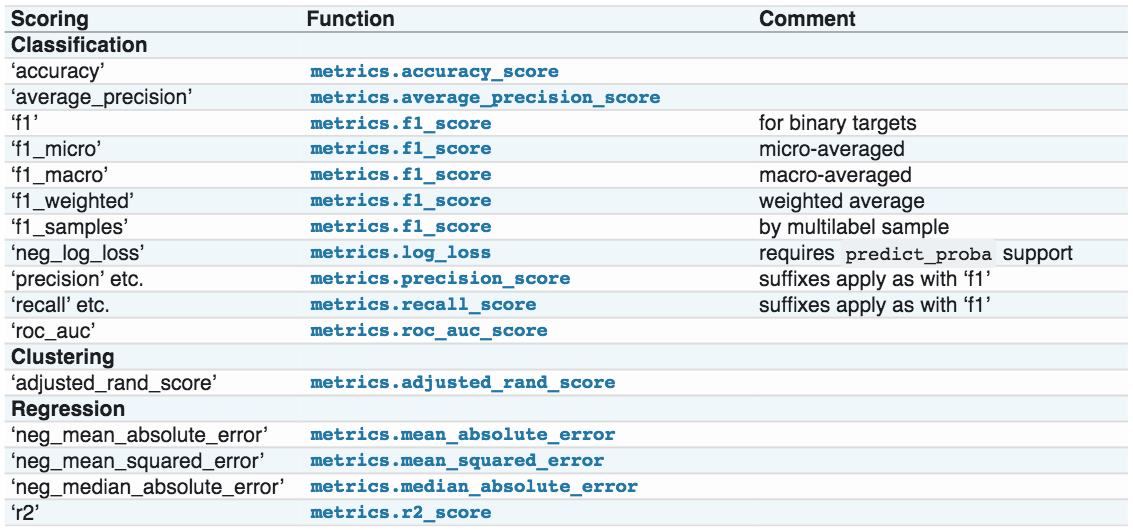
Or simply look up like this:
from sklearn.metrics import SCORERS
print("Available scorers:\n{}".format(sorted(SCORERS.keys())))
Available scorers:
['accuracy', 'adjusted_mutual_info_score', 'adjusted_rand_score', 'average_precision', 'balanced_accuracy', 'completeness_score', 'explained_variance', 'f1', 'f1_macro', 'f1_micro', 'f1_samples', 'f1_weighted', 'fowlkes_mallows_score', 'homogeneity_score', 'jaccard', 'jaccard_macro', 'jaccard_micro', 'jaccard_samples', 'jaccard_weighted', 'max_error', 'mutual_info_score', 'neg_brier_score', 'neg_log_loss', 'neg_mean_absolute_error', 'neg_mean_absolute_percentage_error', 'neg_mean_gamma_deviance', 'neg_mean_poisson_deviance', 'neg_mean_squared_error', 'neg_mean_squared_log_error', 'neg_median_absolute_error', 'neg_root_mean_squared_error', 'normalized_mutual_info_score', 'precision', 'precision_macro', 'precision_micro', 'precision_samples', 'precision_weighted', 'r2', 'rand_score', 'recall', 'recall_macro', 'recall_micro', 'recall_samples', 'recall_weighted', 'roc_auc', 'roc_auc_ovo', 'roc_auc_ovo_weighted', 'roc_auc_ovr', 'roc_auc_ovr_weighted', 'top_k_accuracy', 'v_measure_score']
Cross-validation with AUC
from sklearn.model_selection import cross_val_score, GridSearchCV
from sklearn .svm import SVC
from sklearn.datasets import load_digits
digits = load_digits()

# default scoring for classification is accuracy
print("Default scoring: {}".format(
      cross_val_score(SVC(), digits.data, digits.target == 9)))
# providing scoring="accuracy" doesn't change the results
explicit_accuracy =  cross_val_score(SVC(), digits.data, digits.target == 9,
                                     scoring="accuracy")
print("Explicit accuracy scoring: {}".format(explicit_accuracy))
roc_auc =  cross_val_score(SVC(), digits.data, digits.target == 9,
                           scoring="roc_auc")
print("AUC scoring: {}".format(roc_auc))
Default scoring: [0.975      0.99166667 1.         0.99442897 0.98050139]
Explicit accuracy scoring: [0.975      0.99166667 1.         0.99442897 0.98050139]
AUC scoring: [0.99717078 0.99854252 1.         0.999828   0.98400413]
Hyperparameter tuning#
Now that we know how to evaluate models, we can improve them by tuning their hyperparameters
Grid search#
Create a parameter grid as a dictionary
Keys are parameter names
Values are lists of hyperparameter values
param_grid = {'C': [0.001, 0.01, 0.1, 1, 10, 100],
              'gamma': [0.001, 0.01, 0.1, 1, 10, 100]}
print("Parameter grid:\n{}".format(param_grid))
Parameter grid:
{'C': [0.001, 0.01, 0.1, 1, 10, 100], 'gamma': [0.001, 0.01, 0.1, 1, 10, 100]}
GridSearchCV: like a classifier that uses CV to automatically optimize its hyperparameters internallyInput: (untrained) model, parameter grid, CV procedure
Output: optimized model on given training data
Should only have access to training data
from sklearn.model_selection import GridSearchCV
from sklearn.svm import SVC
grid_search = GridSearchCV(SVC(), param_grid, cv=5)
X_train, X_test, y_train, y_test = train_test_split(
        iris.data, iris.target, random_state=0)
grid_search.fit(X_train, y_train)
GridSearchCV(cv=5, estimator=SVC(),
             param_grid={'C': [0.001, 0.01, 0.1, 1, 10, 100],
                         'gamma': [0.001, 0.01, 0.1, 1, 10, 100]})
The optimized test score and hyperparameters can easily be retrieved:
print("Test set score: {:.2f}".format(grid_search.score(X_test, y_test)))
Test set score: 0.97
print("Best parameters: {}".format(grid_search.best_params_))
print("Best cross-validation score: {:.2f}".format(grid_search.best_score_))
Best parameters: {'C': 10, 'gamma': 0.1}
Best cross-validation score: 0.97
print("Best estimator:\n{}".format(grid_search.best_estimator_))
Best estimator:
SVC(C=10, gamma=0.1)
When hyperparameters depend on other parameters, we can use lists of dictionaries to define the hyperparameter space
param_grid = [{'kernel': ['rbf'],
               'C': [0.001, 0.01, 0.1, 1, 10, 100],
               'gamma': [0.001, 0.01, 0.1, 1, 10, 100]},
              {'kernel': ['linear'],
               'C': [0.001, 0.01, 0.1, 1, 10, 100]}]
print("List of grids:\n{}".format(param_grid))
List of grids:
[{'kernel': ['rbf'], 'C': [0.001, 0.01, 0.1, 1, 10, 100], 'gamma': [0.001, 0.01, 0.1, 1, 10, 100]}, {'kernel': ['linear'], 'C': [0.001, 0.01, 0.1, 1, 10, 100]}]
Nested cross-validation#
Nested cross-validation:
Outer loop: split data in training and test sets
Inner loop: run grid search, splitting the training data into train and validation sets
Result is a just a list of scores
There will be multiple optimized models and hyperparameter settings (not returned)
To apply on future data, we need to train
GridSearchCVon all data again
scores = cross_val_score(GridSearchCV(SVC(), param_grid, cv=5),
                         iris.data, iris.target, cv=5)
print("Cross-validation scores: ", scores)
print("Mean cross-validation score: ", scores.mean())
Cross-validation scores:  [0.96666667 1.         0.9        0.96666667 1.        ]
Mean cross-validation score:  0.9666666666666668
Parallelizing cross-validation and grid-search#
On a practical note, it is easy to parallellize CV and grid search
cross_val_scoreandGridSearchCVhave an_jobsparameter defining the number of cores it can use.set it to
n_jobs=-1to use all available cores.
Random Search#
RandomizedSearchCVworks likeGridSearchCVHas
n_iterparameter for the number of iterationsSearch grid can use distributions instead of fixed lists
from sklearn.model_selection import RandomizedSearchCV
from scipy.stats import expon

param_grid = {'C': expon(scale=100),
              'gamma': expon(scale=.1)}
random_search = RandomizedSearchCV(SVC(), param_distributions=param_grid,
                                   n_iter=20)
X_train, X_test, y_train, y_test = train_test_split(
        iris.data, iris.target, random_state=0)
random_search.fit(X_train, y_train)
RandomizedSearchCV(estimator=SVC(), n_iter=20,
                   param_distributions={'C': <scipy.stats._distn_infrastructure.rv_frozen object at 0x282abbc40>,
                                        'gamma': <scipy.stats._distn_infrastructure.rv_frozen object at 0x2824ad1f0>})